
On 2 September the Reserve Bank of New Zealand published its full quarterly Monetary Policy Statement and raised the Official Cash Rate by 25 basis points to 2.75%. The print matched the modal street call. The same Statement’s OCR track — a December-quarter average of 2.81% — is consistent with an unchanged decision on 28 October and a further 25bp move to 3.00% on 9 December. Westpac’s house view still ends 2026 at 3% and still peaks near 4% in 2027; the RBNZ’s own published path tops out near 3.28% by late 2029. Those are not the same story. On 3 September Bank Negara Malaysia held the Overnight Policy Rate at 2.75%. On 16 September the Federal Reserve raised the federal funds target range by 25 basis points to 3.75–4.00%.
In August we wrote that the US jobs print and Malaysia’s 6.0% quarter had flipped the rate conversation, and that 2 September was the most important data event for the NZ property market between now and year end. That statement has now landed. For wholesale investors in high-yielding NZ and Malaysian commercial assets, both of those developments have to be read against a split that has not moved: in New Zealand the case is income; in Malaysia the case is structural growth.
This edition covers:
- What the 2 September RBNZ Monetary Policy Statement did to the July hiking setup — OCR to 2.75%, a track that softens October, further hikes still live — and why the NZ so-what is unchanged
- The second rate event now printed: the 16 September FOMC hiked 25bp to 3.75–4.00%, after August US payrolls of +162,000 against a ~53,000–56,000 consensus
- Malaysia as the still-held contrast: OPR held at 2.75% on 3 September; H1 growth 5.7%; stance “consistent with” price stability and sustainable growth
- Why high-yielding outskirt and large-format assets still do not require rate cuts to perform — they require vacancy
- New Zealand and Malaysia market updates, including the Johor RTS clock now about four months to January 2027
- Featured listings that restate this MPS-month thesis
1. The Statement: A Hike That Matched the Street, a Track That Softened October
The Monetary Policy Committee reached consensus — Anna Breman chairing; Carl Hansen, Hayley Gourley, Karen Silk, Paul Conway, Prasanna Gai — to lift the OCR from 2.50% to 2.75%. Going in, the street’s modal call was exactly that. Bloomberg’s 31 August poll had all 21 economists at +25bp; Reuters (~90%) and Westpac OIS (~95%) were in the same band. This was not a surprise. Do not write it as one.
What matters is the track and the language around the next meeting. The RBNZ’s September OCR projections put the December-quarter average at 2.81%, down a touch from May's 2.84%. Westpac's 2 September review is explicit: that figure is exactly consistent with a hold on 28 October and a 25bp hike on 9 December. A hike in October followed by a December pause would have printed closer to 2.93%. Assistant Governor Silk’s media line after the meeting — that the choice between an October and a December move is still open, with December currently the more likely reading of the track — matches that Westpac's arithmetic.
The Record of Meeting is careful. Conditional on the central outlook, members judged the OCR may need to increase further. The future path is not pre-determined. The response to data is not mechanical. The press release line that will be quoted all month: gradually removing stimulus “reduces the risk that the OCR needs to increase by more later.”
Inflation is the reason the hike happened, and the reason the track is not hawkish in the Westpac-house sense. Headline CPI rose to 4.1% in the June quarter on fuel and Middle East cost pass-through — above the RBNZ’s July forecast of a 3.9% peak. Excluding vehicle fuels, annual CPI was 2.9%. Most core measures are already inside the 1–3% band. The Statement still expects inflation back inside the band by mid-2027 and at the 2% midpoint later next year, with the Record of Meeting forecasting 2% by late 2027. Near-term inflation is a little softer than May; non-tradables have been revised firmer. That is the persistence debate inside the room.
On risks the Committee split, not on the 25bp. Gourley, Silk, Gai, and Breman saw upside inflation risks versus the central projection — sticky energy and petrochemical prices, front-loaded price-setting, administered prices. Conway and Hansen saw inflation risks balanced and activity skewed down — weak house prices, precautionary household behaviour. All six agreed downside activity risks are significant and the recovery can stay uneven.
That unevenness is usable for commercial property. Export-exposed sectors and regional New Zealand are supported by resilient trading-partner demand and strong export prices. Household spending and residential investment remain weak, “particularly in Auckland and Wellington.” Spare capacity remains, especially in the labour market. Unemployment in the June quarter was 5.6%, above the RBNZ’s 5.4% projection. This is still a two-speed domestic economy. It is still an income market for wholesale commercial assets.
Street versus desk after the print: report the hawkish forecasts honestly. Westpac’s own house view, reconfirmed after the Statement, still has an October pause, a December hike to 3%, and a peak near 4% by September 2027 — and still says the RBNZ is unlikely to endorse that profile. ASB’s own year-end remains more hawkish than the RBNZ track; ANZ’s “promptly to 3.0% this year” sits next to a softer RBNZ December-quarter average. Do not average them. The desk’s job is to name the gap: the RBNZ published a hike and a data-dependent path that softens October; several banks remain more aggressive into 2027. For assets already generating 7% to 8% income in tight-vacancy corridors, that gap does not retire the income case.
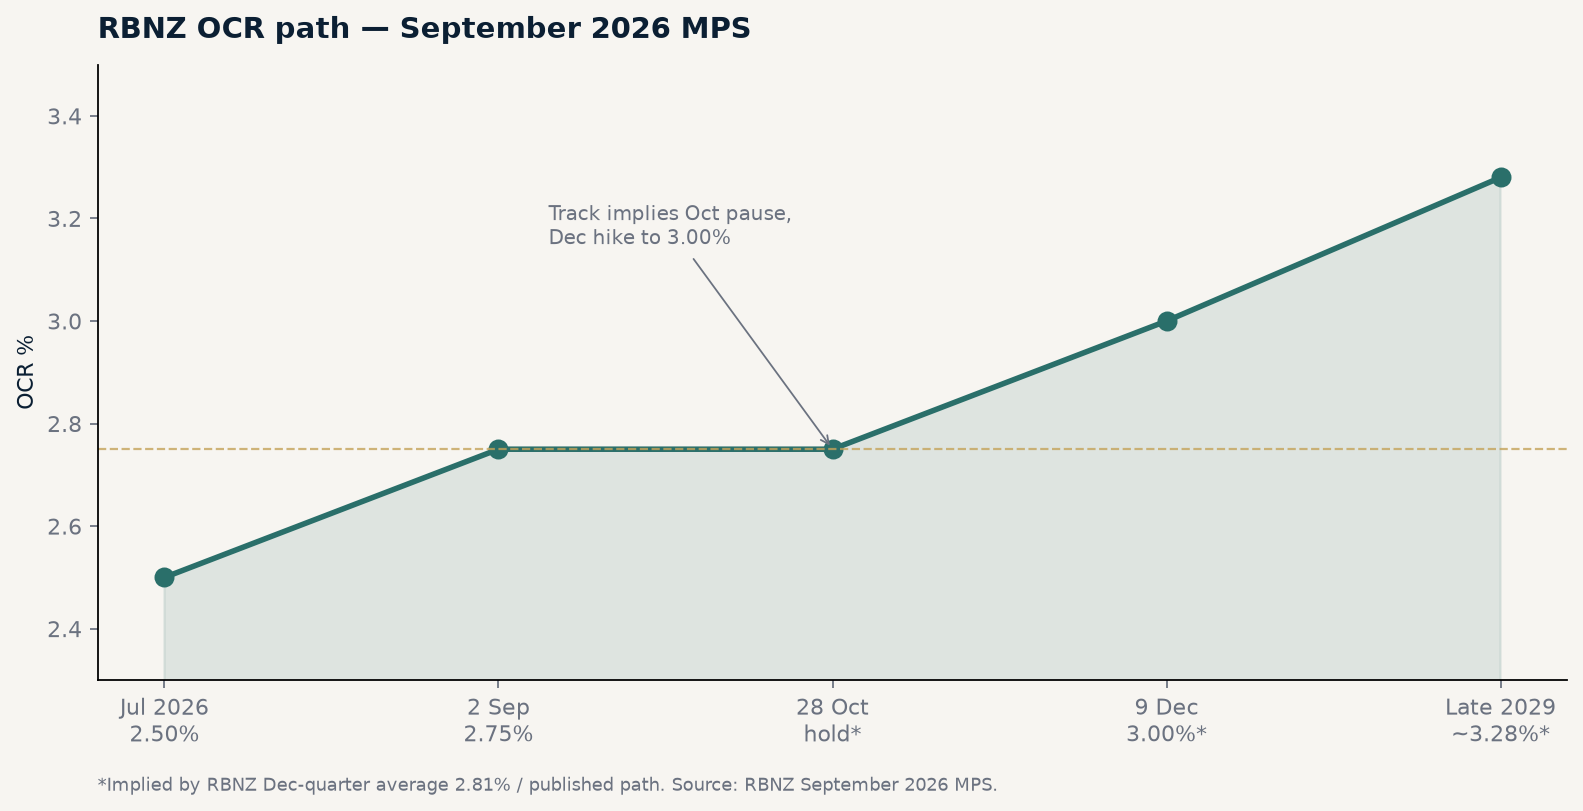
Source: RBNZ September 2026 MPS
2. The Second Rate Event: FOMC Printed 16 September
On 16 September the Federal Open Market Committee raised the federal funds target range by 25 basis points to 3.75–4.00%, by a 12–0 vote. Going into the meeting the range had been 3.50–3.75% after the July hold. The print matched the post–Jackson Hole hike lean that had built after August nonfarm payrolls of +162,000 (consensus near 53,000–56,000) and the subsequent data path into the meeting.
For NZ and Malaysian commercial property the transmission pipe is unchanged from August: long-end yields, the dollar, and whether the 2026 rate headwind has a lower ceiling. Do not build a US essay. The dated open for this edition can now carry three prints — RBNZ 2 September, BNM 3 September, and FOMC 16 September without a calendar clause.
Source: Federal Reserve FOMC statement 16 Sep 2026 / BLS Employment Situation August 2026 / CNBC, Reuters 4 Sep 2026
3. Malaysia: Still Held, Still the Financing Contrast
On 3 September Bank Negara Malaysia’s MPC maintained the OPR at 2.75%. The print matched the modal street call. Official stance: at the current OPR level, policy is “consistent with the outlook of continued price stability and sustainable economic growth.” The MPC “will remain vigilant to cost pressures and domestic demand conditions.”
The numbers behind the hold are continuity, not a rerun of August’s 6.0% celebration. H1 2026 growth 5.7%; 2026 growth expected around 5% and resilient into 2027; headline and core inflation averaged 1.8% and 2% in the first seven months. Pass-through to consumer prices has been contained by domestic policy measures and stable demand amid limited spillover of external strength to wages. Middle East / commodity cost pressures remain fluid — the vigilance clause, not a hike signal.
Relative to the governor’s 14 August line — “stronger growth does not necessarily point to an OPR hike” — this statement is still a hold. The relative financing gap versus New Zealand has widened one step: OCR is now 2.75% after a second consecutive hike; OPR is unchanged at 2.75% since July 2025. September’s job is whether that gap changed. It did, on the NZ side. Do not escalate Malaysia into a BNM tightening story from this hold alone.
Q2 GDP of 6.0% (14 August), manufacturing 7.3%, and exports +17% remain the occupancy story underneath the rate story. Demand for industrial and logistics is not sentiment. It is factories that are actually being built.
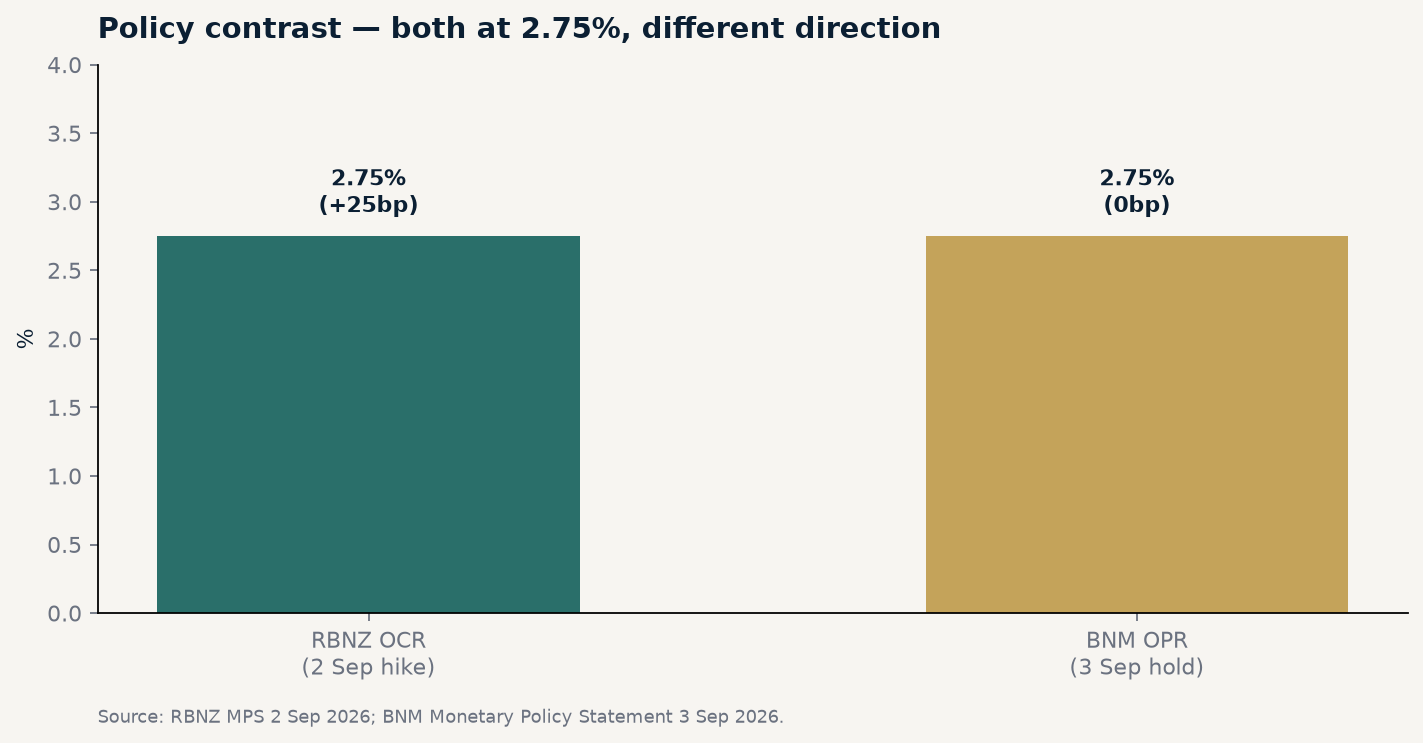
Source: RBNZ September 2026 MPS / Bank Negara Malaysia Monetary Policy Statement 3 Sep 2026
4. Translate into Commercial Property: Income First, Spread Still Mispriced
Flight to quality is not wrong — it is incomplete. For wholesale investors deploying significant capital into large-format commercial and industrial stock, the interesting trade is not Grade A versus secondary. It is well-located, high-yielding, large-format assets in supply-constrained corridors versus anything else available at comparable cheque size.
The arithmetic has not moved with the Statement. A Grade A office tower in a liquid KL corridor at ~5.5% is a defensive, liquid position. A large-format industrial or commercial building in a tight-vacancy outskirt corridor at 7.5% to 8.5% is a structurally different proposition. The yield spread is 200 to 300 basis points. On a large-format asset, that spread is significant annual income. Most retail investors are not operating at the scale where it is accessible, which is why the broader market still misprices it.
In New Zealand, outskirt industrial in South Auckland — vacancy below 3% on the August broker page and regional commercial above 8%, social housing with government-aligned net leases, healthcare / essential services, and urban car parks are the income book. (Christchurch industrial is corridor-specific; do not read a citywide sub-3% vacancy into this sentence.) Assets already generating 7% to 8% income in constrained-supply markets do not need rate cuts to perform. They require vacancy. A hike makes the entry point less comfortable for leveraged sideline capital. It does not retire the income case. Replacement costs are up since 2022; consents remain well below the 2022 peak; yield-compression risk, if conditions improve, is asymmetric to the upside.
In Malaysia, outskirt industrial and logistics in Johor and Klang Valley still sit in the real-yield band developed markets cannot easily replicate — August page 5–7% against sub-2% inflation — with JS-SEZ demand under the January 2025 bilateral framework and implementation continuing through 2026. The OPR hold keeps the financing contrast live while NZ removes stimulus.
"High-yielding outskirt assets in supply-constrained corridors do not require rate cuts to perform. They require vacancy, and vacancy in the corridors that matter is already structurally low. The rate flip is upside, not prerequisite."
5. New Zealand Market Update
New Zealand is navigating a period of genuine difficulty, and we think it is more useful to address that directly than to frame it otherwise. The September Statement confirms the direction of travel without endorsing the most aggressive house views on the street.
OCR is 2.75% after consecutive hikes on 8 July and 2 September. Next events: 28 October MPR, 9 December MPS, 10 February MPR. The published track implies year-end nearer 3% via December rather than via October. Inflation returned above the band on fuel; core is largely inside; the midpoint target remains late-2027. Growth was lacklustre in Q2 and is expected to resume unevenly in Q3 — export and regional strength versus weak household spending and residential investment in Auckland and Wellington. Unemployment 5.6% in Q2. Spare capacity remains.
For commercial property the practical implication is unchanged from July and August: this is an income cycle, not a capital appreciation cycle. Social-housing net lease is the ballast listing for a hiking branch. Outskirt industrial and regional commercial above 8% are the income listings that survive a pause and a hike. Do not read US payrolls or a soft RBNZ October signal as a reason to wait for NZ capital appreciation. Certainty is a lagging indicator. The income is already in the lease.
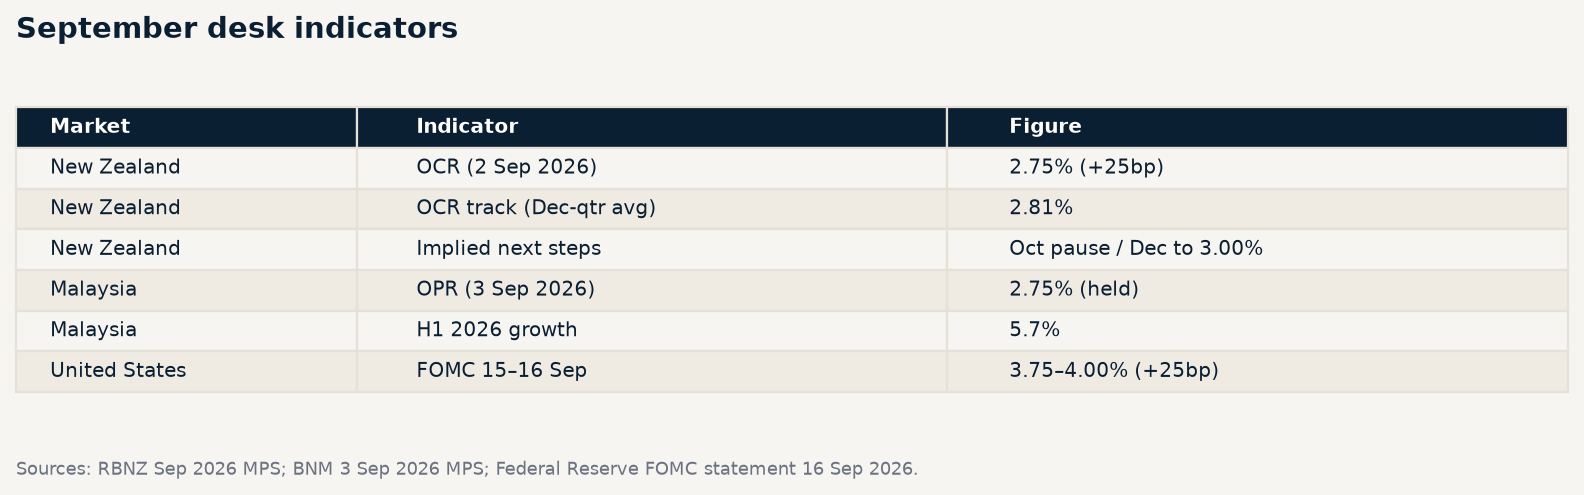
Source: RBNZ September 2026 MPS / BNM 3 Sep 2026 / Federal Reserve FOMC statement 16 Sep 2026 / Westpac IQ / Stats NZ
6. Malaysia Market Update / Johor Clock
In New Zealand the case is income. In Malaysia the case is structural growth. Both are valid. The mistake is applying the same framework to both.
OPR 2.75%, held 3 September. H1 growth 5.7%; full-year around 5%. Inflation averages 1.8% / 2% over seven months. Industrial and logistics demand continues to be generated by projects already in implementation — not by a narrative about 6% GDP repeating.
The Johor–Singapore RTS Link remains dated to 1 January 2027. In June we called a six-month window. By mid-September the window is about four months, not six. Stations are physically complete; testing and commissioning are underway; fare and exact commencement are still to be announced jointly. Waiting for the opening is the sidelines error applied to Johor. Occupier demand in the JS-SEZ (agreement January 2025; implementation through 2026) and in Klang Valley industrial does not require the first passenger.
Source: BNM Monetary Policy Statement 3 Sep 2026 / The Star / Malay Mail 18 Aug 2026 (RTS testing phase)
Featured Listings
The following assets reflect this edition's thesis: NZ income already present under a hiking, data-dependent OCR path; Malaysia structural occupancy under a still-held OPR. Each is positioned where the income or occupier case does not depend on rate cuts or a ribbon-cutting to perform. Further details and information packages available on request.
New Zealand
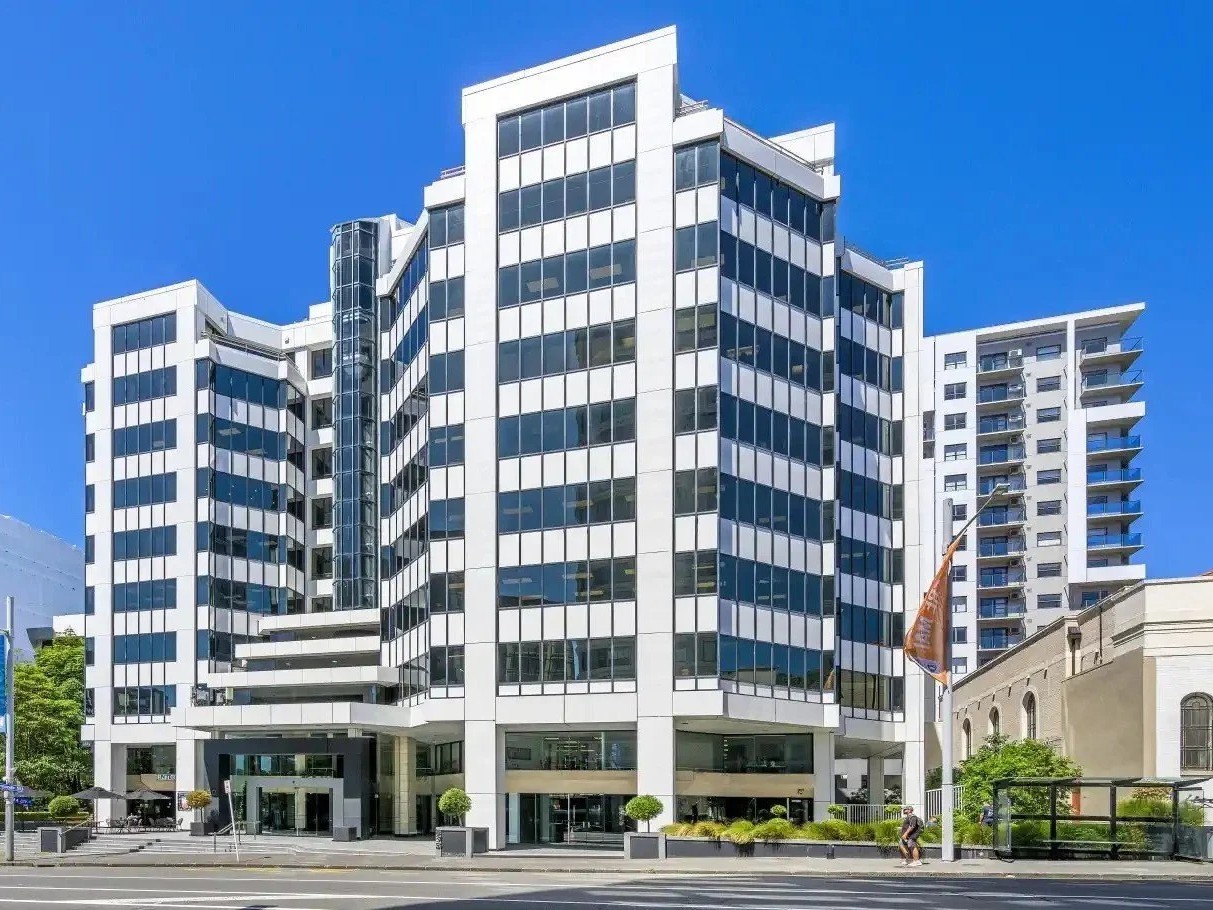
Auckland Fringe — Dual-Tower Office Complex
| Property Type | CBD-Fringe Office / Mixed-Use Commercial Complex |
| Estimated Value | ~NZD 40M |
| Estimated Yield | ~7.0% |
| Occupancy | ~90% |
| Land Area | ~4,000 sqm |
| Built Area | ~12,500 sqm across dual towers |
| Method of Sale | By Negotiation |
Notes: A dual-tower CBD-fringe office complex in an established Auckland location with strong transport connectivity and proximity to education, hospitality, and community amenity nodes. Substantial land footprint across two towers supports multiple tenancy arrangements. Current occupancy generates near-term income while preserving site optionality.
Investment Potential: Read this as optionality-plus-income at a core-plus yield, not as a CBD recovery bet. At approximately 7.0% on ~90% occupancy, the asset pays today while the 10% vacancy is re-leasing upside a patient wholesale buyer does not pay for at entry. Under a data-dependent hiking path, that income-plus-optionality register matters more than a capital-appreciation story. Contact us for the full information memorandum.
South Auckland — Purpose-Built Social Housing Portfolio
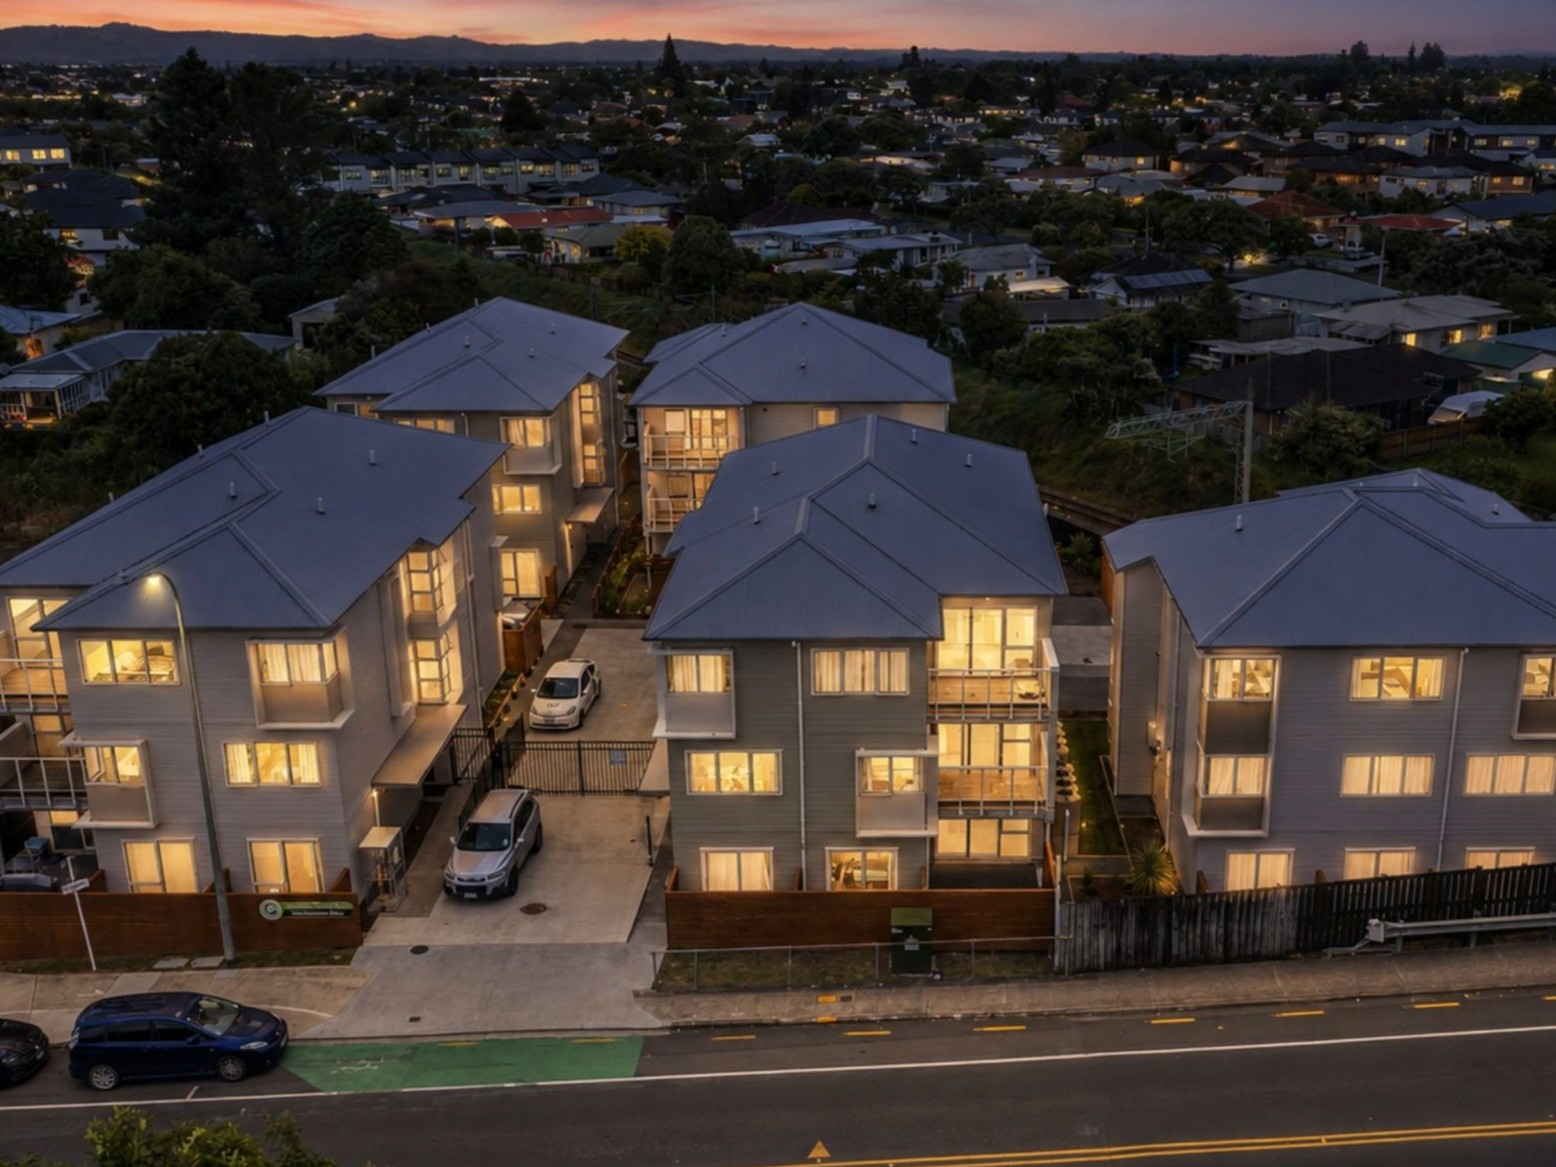
| Property Type | Social Housing Investment Portfolio |
| Estimated Value | ~NZD 17.35M |
| Estimated Yield | ~7.75% net |
| Tenure | 5 × Individual Freehold Titles |
| Buildings | 5 standalone buildings, 75 self-contained units total |
| Lease Term | 12-year leases with rights of renewal |
| Lease Structure | Net lease |
| Tenancy | Established charitable trust, government-aligned operator |
| Vendor Finance | Up to 75% LVR available for approved buyers |
| Method of Sale | Price by Negotiation |
Notes: Purpose-built, fully leased social housing portfolio completed in 2023, five standalone buildings on separate freehold titles, leased to an established charitable trust aligned with government housing frameworks on 12-year net leases with rights of renewal. Vendor finance up to 75% LVR for approved buyers.
Investment Potential: This is the MPS-hike ballast. Income underpinned by a government-aligned operator and long-term net leases is not sensitive to the OCR the way office or discretionary retail is. At ~7.75% net across five separate freehold titles, the yield spread over term deposits remains compelling at wholesale scale, and the title structure preserves selective exit or institutional roll-up. A second consecutive OCR hike does not retire this income case — it is why the asset sits in this edition. Contact us for full lease and financial details.
Malaysia
Kuala Lumpur (Decentralised Grade A Corridor) — Corporate Tower, En Bloc
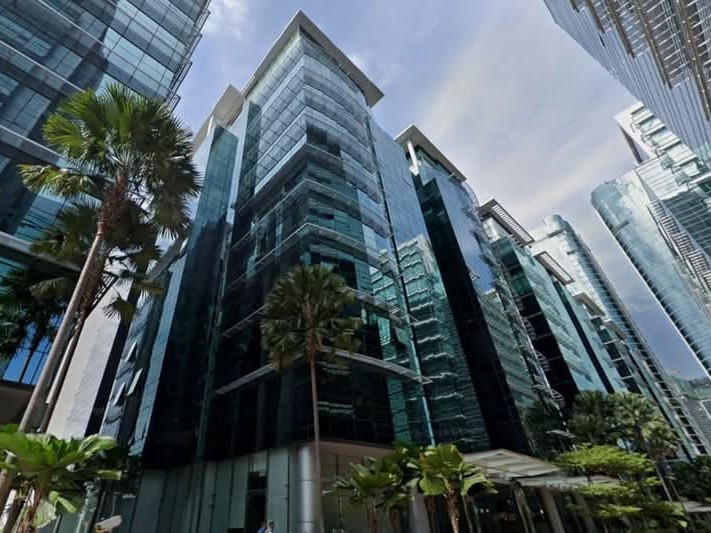
| Property Type | Grade A Commercial Office Tower (En Bloc) |
| Estimated Value | ~RM 228M |
| Estimated Yield | ~5.5% |
| Floor Area | ~247,000 sqft |
| Price per sqft | ~RM 923 psf |
| Tenure | Leasehold (98 years remaining) |
| Specification | Full corporate fit-out, 100% power backup, high-speed lifts, multi-level car park |
Notes: En bloc Grade A corporate tower in one of KL’s most established decentralised office corridors, full corporate specification, single en bloc title — suits a regional corporate owner-occupier or institutional value-add repositioning.
Investment Potential: Read this off the OPR-versus-OCR financing gap and occupier demand, not off “Malaysia printed 6%.” BNM held at 2.75% on 3 September while the RBNZ removed another 25bp of stimulus. Technology, financial services, and AI-adjacent firms expanding into quality KL corridors are doing so against genuine economic expansion and a still-accommodative local policy stance. Contact us for the full asset brief and tenancy schedule.
Klang Valley Fringe Grade A Corporate Office Tower, MSC Designated
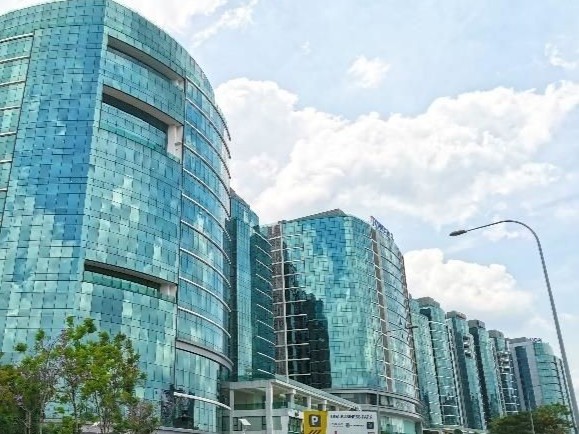
| Property Type | Grade A Corporate Office Tower |
| Estimated Value | ~RM 120M |
| Estimated Yield | ~6.0% |
| Floor Area | ~126,000 sqft |
| Tenure | Freehold |
| Designation | MSC Malaysia Cybercentre |
Notes: Boutique Grade A office tower in an established Klang Valley fringe hub between KL’s CBD and the industrial hubs of Shah Alam and Port Klang. MSC Cybercentre designation; freehold tenure at this price point is a material differentiator.
Investment Potential: Decentralisation demand from CBD corporates plus MSC-eligible technology tenants is an occupancy story, not a trophy story. Freehold at ~6.0% under a held OPR keeps the risk-adjusted mid-market office case intact while NZ rates grind higher. Prefer a live Johor industrial / logistics IM in this slot if Daarshan can source one before publish — this edition’s Malaysia thesis is stronger with at least one industrial asset. Contact us for the full tenancy and leasing schedule.
For more info on any of the above listings, contact the Fairhaven team directly.
Petrus Yen — Petrus@fairhavenproperty.co.nz
Daarshan Kunasegaran — Daarshan.Kunasegaran@fairhavenproperty.co.nz
Disclaimer: The information provided is based on publicly available data and internal analysis. For informational purposes only. Not financial advice. Property details and projections are indicative only. Readers should conduct independent due diligence before making any investment decisions.