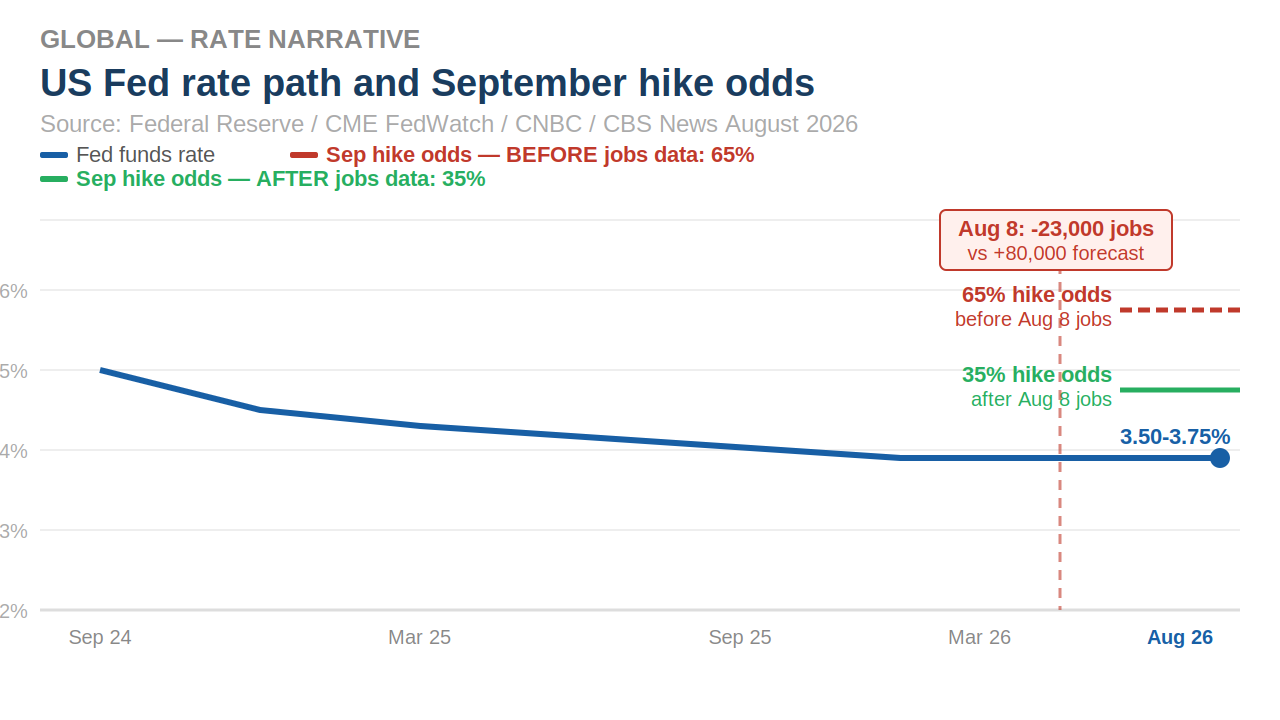
Two things happened this month that changed the rate conversation entirely. On August 8, the United States reported that its economy shed 23,000 jobs in July, the first monthly payroll decline in years, against a forecast of 80,000 gains. The odds of a Federal Reserve rate hike in September flipped from majority expectation to a 65% probability of a hold. Then on August 14, Bank Negara Malaysia released Q2 GDP data showing the Malaysian economy expanded 6.0% year-on-year, beating the 5.8% consensus forecast and accelerating from 5.4% in Q1. The OPR remained at 2.75%, unchanged for over a year, with economists broadly expecting it to stay there through December.
In July we wrote about a two-speed world defined by war and technology. August has added a third dimension: a global rate narrative that reversed in the space of a week. And for property investors focused on high-yielding assets in well-located outskirt and industrial corridors, both of those developments point in the same direction.
This edition covers:
- How the July US jobs report flipped the rate outlook and what that means for cross-border capital
- Malaysia's Q2 2026 GDP of 6.0%: what the data says, what BNM is signalling, and why the OPR hold is as important as the growth number
- New Zealand heading into the September 2 RBNZ Monetary Policy Statement, and what the central bank's own inflation forecast suggests about the path ahead
- Why high-yielding outskirt and large-format commercial assets are the most rational position in the current cycle for wholesale investors
- Market data and chart updates for both markets
1. The Flip: How the Rate Narrative Changed in August
The US employment data released on August 8 was the most significant single data point for global rate expectations since the ceasefire collapsed in July. The US economy shed 23,000 jobs in July, against a forecast of positive 80,000. The Labor Department also revised May and June hiring data down by a combined 103,000. The unemployment rate ticked up to 4.3%.
Ordinarily, weak jobs data would rattle markets. Instead, stocks rallied to all-time highs. The S&P 500 closed at a record. The Nasdaq jumped 1.3%. The reason was straightforward: if the labour market is weakening, the Federal Reserve is less likely to raise rates and potentially more likely to cut them. At the Fed's July meeting, three FOMC members had dissented in favour of hiking. That conversation has now collapsed. Traders on prediction markets now assign a 65% probability to the Fed holding in September, reversing what had been a majority expectation for a hike just days earlier.
This matters for property investors in two direct ways. First, US long-term rates are softening. The 10-year Treasury yield, which has been the primary driver of elevated mortgage rates globally, is responding to the jobs data and the July CPI print released on August 15, which showed headline inflation at 3.4% year-on-year with core at 2.5%, both a tenth lower than June. Disinflation is resuming. Second, cross-border capital flows are responding. When US rate expectations ease and the dollar softens, capital that had been anchored in US dollar assets begins to look for yield elsewhere. Asia Pacific real estate, with its combination of structural demand and real yield advantages, is a natural beneficiary.
Oil is also sitting at $77 per barrel, down from the $87 post-ceasefire-collapse peak and well below the $144 April spike. Fresh Iran talks are influencing the energy picture. If oil continues to moderate, global inflation expectations ease further and the rate hiking pressure on central banks across the board diminishes.
For investors in high-yielding NZ and Malaysian commercial assets, the August macro picture is more constructive than it was in July. Not dramatically more constructive, but directionally improved. The rate headwind that has been the primary constraint on transaction activity in 2026 appears to have a lower ceiling than the market was pricing a month ago.
2. Malaysia at 6%: The Confirmation Nobody Was Expecting
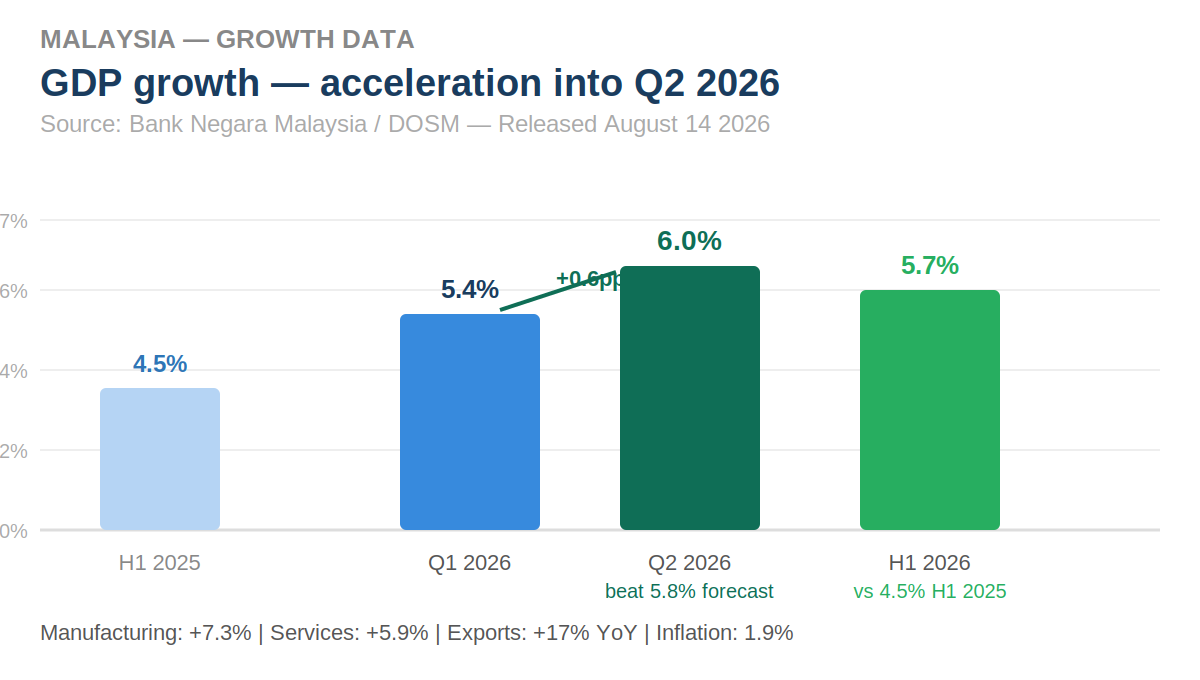
Malaysia's Q2 2026 GDP number, released by Bank Negara Malaysia on August 14, was one of those data points that is hard to argue with.
The economy expanded 6.0% year-on-year in the April-June quarter, higher than the official advance estimate of 5.8%, which had itself already beaten the Reuters consensus of 5.8%. Growth accelerated from 5.4% in Q1. On a seasonally adjusted basis, the economy grew 2.5% quarter-on-quarter, reversing a marginal contraction in Q1. H1 2026 growth came in at 5.7%, significantly above the 4.5% recorded in the same period of 2025. Manufacturing grew 7.3%. Services grew 5.9%. Exports accelerated 17% year-on-year. Every sector except agriculture posted a better performance than the prior quarter.
BNM Governor Datuk Seri Abdul Rasheed Ghaffour described the Malaysian economy as remaining on firm footing. He said full-year growth is now likely to come in around 5%, the upper end of the central bank's 4% to 5% forecast range. JP Morgan raised its 2026 Malaysia GDP forecast to 5.3% from 5.0% following the Q2 release.
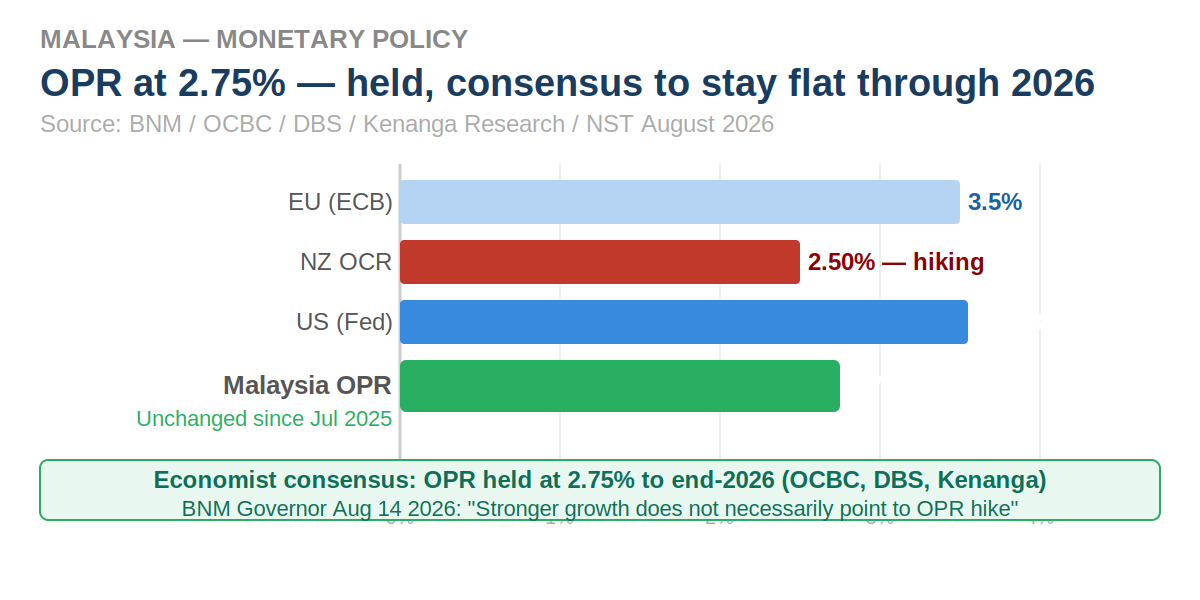
The more important signal for investors came in the same breath. Asked whether the 6.0% Q2 number would prompt BNM to reverse its July 2025 rate cut and raise the OPR, the governor said stronger growth does not necessarily point to an OPR hike. Monetary policy decisions would not be based on growth alone, he said. Price pressures remain relatively contained, with inflation at 1.9% in Q2. Economists at OCBC, DBS, and Kenanga Research all expect BNM to hold the OPR at 2.75% through the end of 2026. OCBC's base case is a possible 25 basis point hike to 3.0% in early 2027.
The ringgit strengthened against the US dollar immediately following the Q2 release, reinforcing Kenanga Research's view that Malaysia's fundamentals support conversion into ringgit assets and that the current OPR level, combined with macroeconomic stability, is viewed positively by foreign investors.
For property investors, this is the combination that rarely exists simultaneously in any single market: 6% GDP growth, 1.9% inflation, a stable OPR at 2.75%, a strengthening currency, and 85% of manufacturing projects approved since 2021 already in implementation phase ranging from factory construction to production installation. The demand for industrial and logistics infrastructure is not being generated by sentiment. It is being generated by factories that are actually being built.
3. New Zealand: All Eyes on September 2
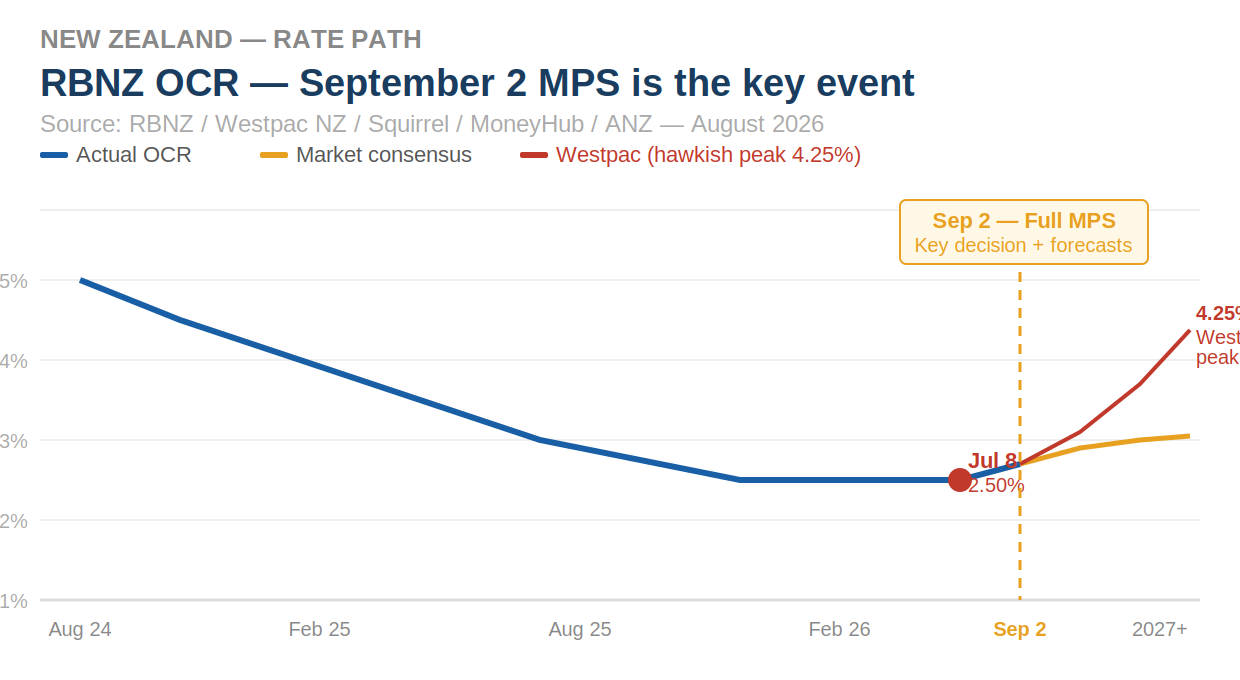
The next RBNZ Monetary Policy Statement lands on September 2. This is the full quarterly statement, not a simple OCR review, which means it will include updated economic forecasts, inflation projections, and the central bank's forward guidance on the rate path. It is the most important data event for the NZ property market between now and year end.
The context going into September 2 is more nuanced than the July hiking narrative suggested. The RBNZ's own July statement projected that annual headline inflation peaked at 3.9% in the June 2026 quarter and is expected to decline to 3.3% in the September quarter. The central bank noted that the lower oil price assumption, significantly below what was built into the May Statement, is reducing direct price effects and pass-through to other consumer prices. Economic growth is projected to resume in the September 2026 quarter. Non-performing housing loans have declined, and banks expect further reductions in commercial property impairments over 2026.
This is not the picture of a central bank with an unambiguous mandate to hike aggressively. Future OCR decisions are explicitly data-dependent, and the data since July has evolved in a direction that complicates the case for consecutive hikes. The US jobs print, the oil price moderation, and the RBNZ's own inflation peak forecast all create some room for the September 2 statement to be more measured than the most hawkish forecasters are projecting.
That said, Westpac's forecast remains the most aggressive on the street: OCR to 4.00% by end-2027, peaking at 4.25% in 2028. ANZ expects 1-year mortgage rates at 5.2% by December 2026. These are live forecasts from credible institutions, and they frame the direction of travel honestly: NZ rates are going up from here, not down. The September 2 statement will give the market its first comprehensive read on how far and how fast.
For commercial property investors in New Zealand, the practical implication is unchanged from July: this is an income cycle, not a capital appreciation cycle. But the August macro data adds a layer of nuance. If the RBNZ pauses on September 2, or delivers a softer forward guidance signal than the hawkish consensus expects, the yield premium available on well-located high-yielding commercial assets becomes even more attractive relative to the alternatives. Assets already generating 7% to 8% income in constrained supply markets do not need rate cuts to perform. But a less aggressive hiking path makes the entry point more compelling for investors currently on the sidelines.
 Source: RBNZ July 2026 MPS / Squirrel / MoneyHub NZ / Westpac NZ
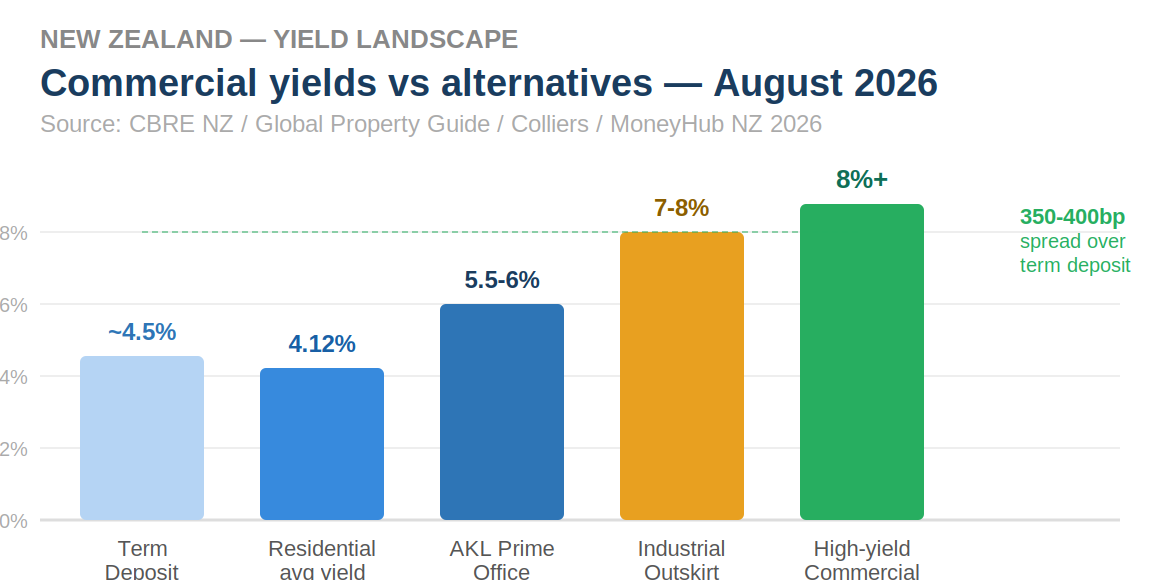 Source: CBRE NZ 2026 Outlook / Global Property Guide / Colliers NZ
4. Why High-Yielding Outskirt Assets Win in Every Rate Environment
The flight-to-quality narrative that dominates financial media discussion of commercial real estate is not wrong. Grade A assets in prime locations do outperform in a recovery. But for wholesale investors deploying significant capital into large-format commercial and industrial property, the more interesting trade is not Grade A versus secondary. It is well-located, high-yielding, large-format assets in supply-constrained corridors versus anything else available at comparable capital deployment size.
Here is the arithmetic that wholesale investors are working with in August 2026. A Grade A office tower in Bangsar South at 5.5% yield is a defensive, liquid position with strong tenant covenants. A large-format industrial facility or commercial building in a well-connected outskirt corridor at 7.5% to 8.5% yield, in a precinct where vacancy is structurally low and replacement cost has risen materially since 2022, is a structurally different proposition. The yield spread is 200 to 300 basis points. On a large-format asset, that spread represents significant annual income differential. And in the current rate environment, where every basis point of yield matters, that spread is not being priced correctly by the broader market because most retail investors are not operating at the scale where it is accessible.
This is specifically true in the corridors where Fairhaven operates. In Malaysia, outskirt industrial and logistics precincts in the Johor and Klang Valley corridors are generating real yield of 5% to 7% against a 1.9% inflation backdrop. These are not assets that require economic sentiment to improve to deliver returns. They are assets where the underlying demand, manufacturing relocation, e-commerce fulfilment, logistics network expansion, is already present in lease-up rates and vacancy data. Raine and Horne's H2 2026 Mid-Year Review specifically notes that the industrial sector is expected to outperform, driven by data centre investment and manufacturing expansion, and that active industrial ecosystems support more sustainable long-term demand than locations driven mainly by speculative activity.
In New Zealand, the same logic applies at a different scale. Outskirt industrial assets in South Auckland and Christchurch where vacancy is below 3% are generating yields above 8% at a time when term deposits are delivering 4% to 5%. For a wholesale investor placing significant capital, the income differential at scale is material. And the structural supply constraint, replacement construction costs have risen sharply since 2022, means the yield compression risk as conditions improve is asymmetric to the upside.
The critical insight for wholesale investors in August 2026 is this: the flip in US rate expectations does not help Grade A assets more than it helps high-yielding outskirt assets. If anything, it helps the latter more. When the cost of debt eases, the spread between high-yield assets and risk-free rates widens on a relative basis, making the income argument for large-format, well-located secondary stock more compelling, not less.
"High-yielding outskirt assets in supply-constrained corridors do not require rate cuts to perform. They require vacancy, and vacancy in the corridors that matter is already structurally low. The rate flip is upside, not prerequisite."
5. Market Update: August 2026
Global: The US economy shed 23,000 jobs in July, the first monthly payroll decline in years. September Fed hike probability has fallen to 35% from a majority expectation earlier in the month. US July CPI at 3.4% year-on-year with core at 2.5%, both a tenth below June. Oil at $77 per barrel on fresh Iran talks, down from $87 post-ceasefire-collapse peak. S&P 500 at all-time highs. CEO confidence increased in Q3 2026.
Malaysia: Q2 2026 GDP confirmed at 6.0% on August 14, beating consensus. H1 2026 growth at 5.7%. Manufacturing at 7.3% in Q2. Exports up 17% year-on-year. BNM OPR held at 2.75%, unchanged since July 2025. Governor says stronger growth does not necessarily point to OPR hike. Economist consensus holds OPR flat through end of 2026. Ringgit strengthened following GDP release. Full-year growth expected around 5%, upper end of 4% to 5% range. Inflation 1.9% in Q2. 85% of manufacturing projects approved since 2021 in implementation phase.
New Zealand: OCR at 2.50% following July 8 hike. Next Monetary Policy Statement September 2 with full forecasts. RBNZ's own July projection shows headline inflation peaked at 3.9% in June quarter, declining to 3.3% in September quarter. Economic growth projected to resume in September 2026 quarter. Non-performing loans declining and banks expect further reductions in commercial property impairments. Westpac forecasts OCR to 4.00% by end-2027. ANZ forecasts 1-year mortgage rates at 5.2% by December 2026. CBRE NZ: Auckland Prime office net effective rents to benefit from face rent growth and reducing incentives. Industrial: improving demand conditions expected to lead to resumption of modest growth by year end.
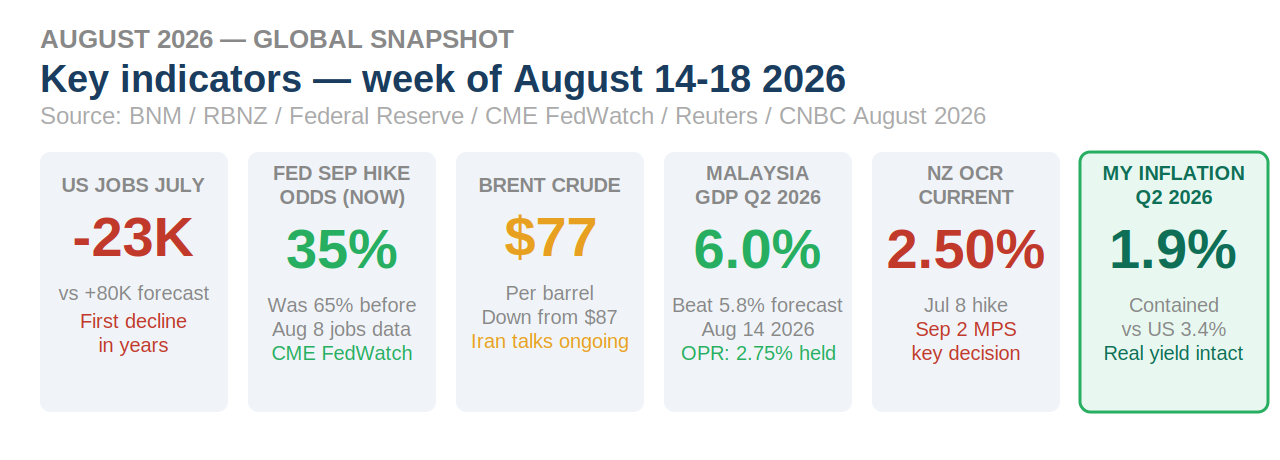 Source: CNBC / CBS News / Rio Times / BNM / RBNZ / CBRE August 2026
6. Featured Listings: Strategic Entry Points
The following assets reflect the wholesale investment thesis outlined in this edition. Each is positioned within a segment where the income case is already present and does not depend on rate cuts or sentiment improvement to perform. Further details and information packages available on request.
New Zealand
Auckland Fringe - Dual-Tower Office Complex
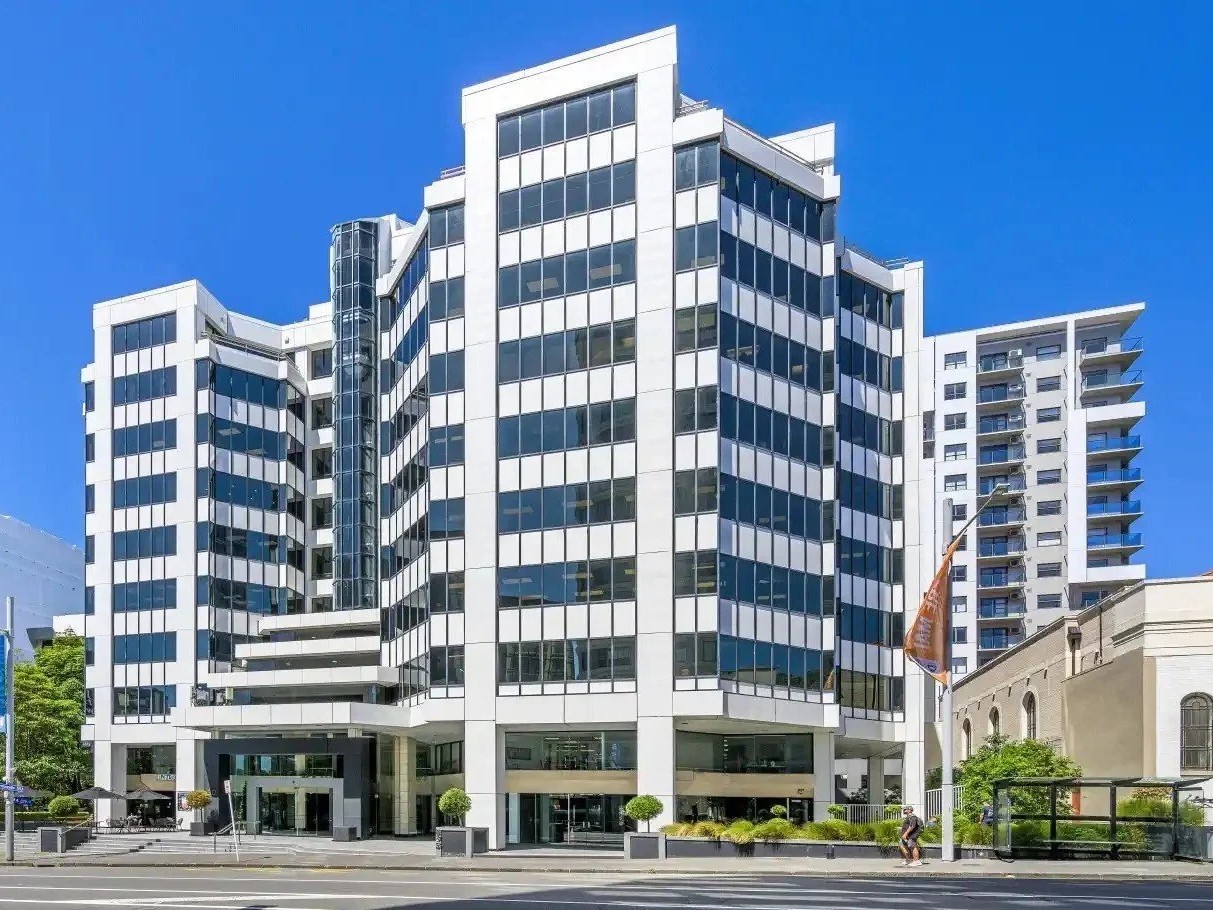
| Property Type | CBD-Fringe Office / Mixed-Use Commercial Complex |
| Estimated Value | ~NZD 40M |
| Estimated Yield | ~7.0% |
| Occupancy | ~90% |
| Land Area | ~4,000 sqm |
| Built Area | ~12,500 sqm across dual towers |
| Method of Sale | By Negotiation |
Notes: A dual-tower CBD-fringe office complex in an established Auckland location with strong transport connectivity and proximity to education, hospitality, and community amenity nodes. The asset occupies a substantial land footprint across two towers, supporting multiple tenancy arrangements simultaneously. Current occupancy generates stable near-term income while preserving meaningful optionality across the site. The corridor has historically served a broad mix of commercial, professional services, and education-adjacent tenants, diversifying income risk beyond single-sector dependency.
Investment Potential: This asset is best understood as an optionality position at a core-plus yield rather than a pure office bet. The dual-tower configuration, land footprint, and transport connectivity create a platform that supports staged re-leasing, targeted upgrades, or a hybrid tenant mix strategy without requiring a full redevelopment commitment. At approximately 7.0% on 90% occupancy in an established Auckland corridor, the asset generates a credible income return today while preserving multiple value creation pathways. The 10% vacancy represents re-leasing upside a patient wholesale investor can capture without paying for it at entry. Contact us for the full information memorandum.
South Auckland - Purpose-Built Social Housing Portfolio
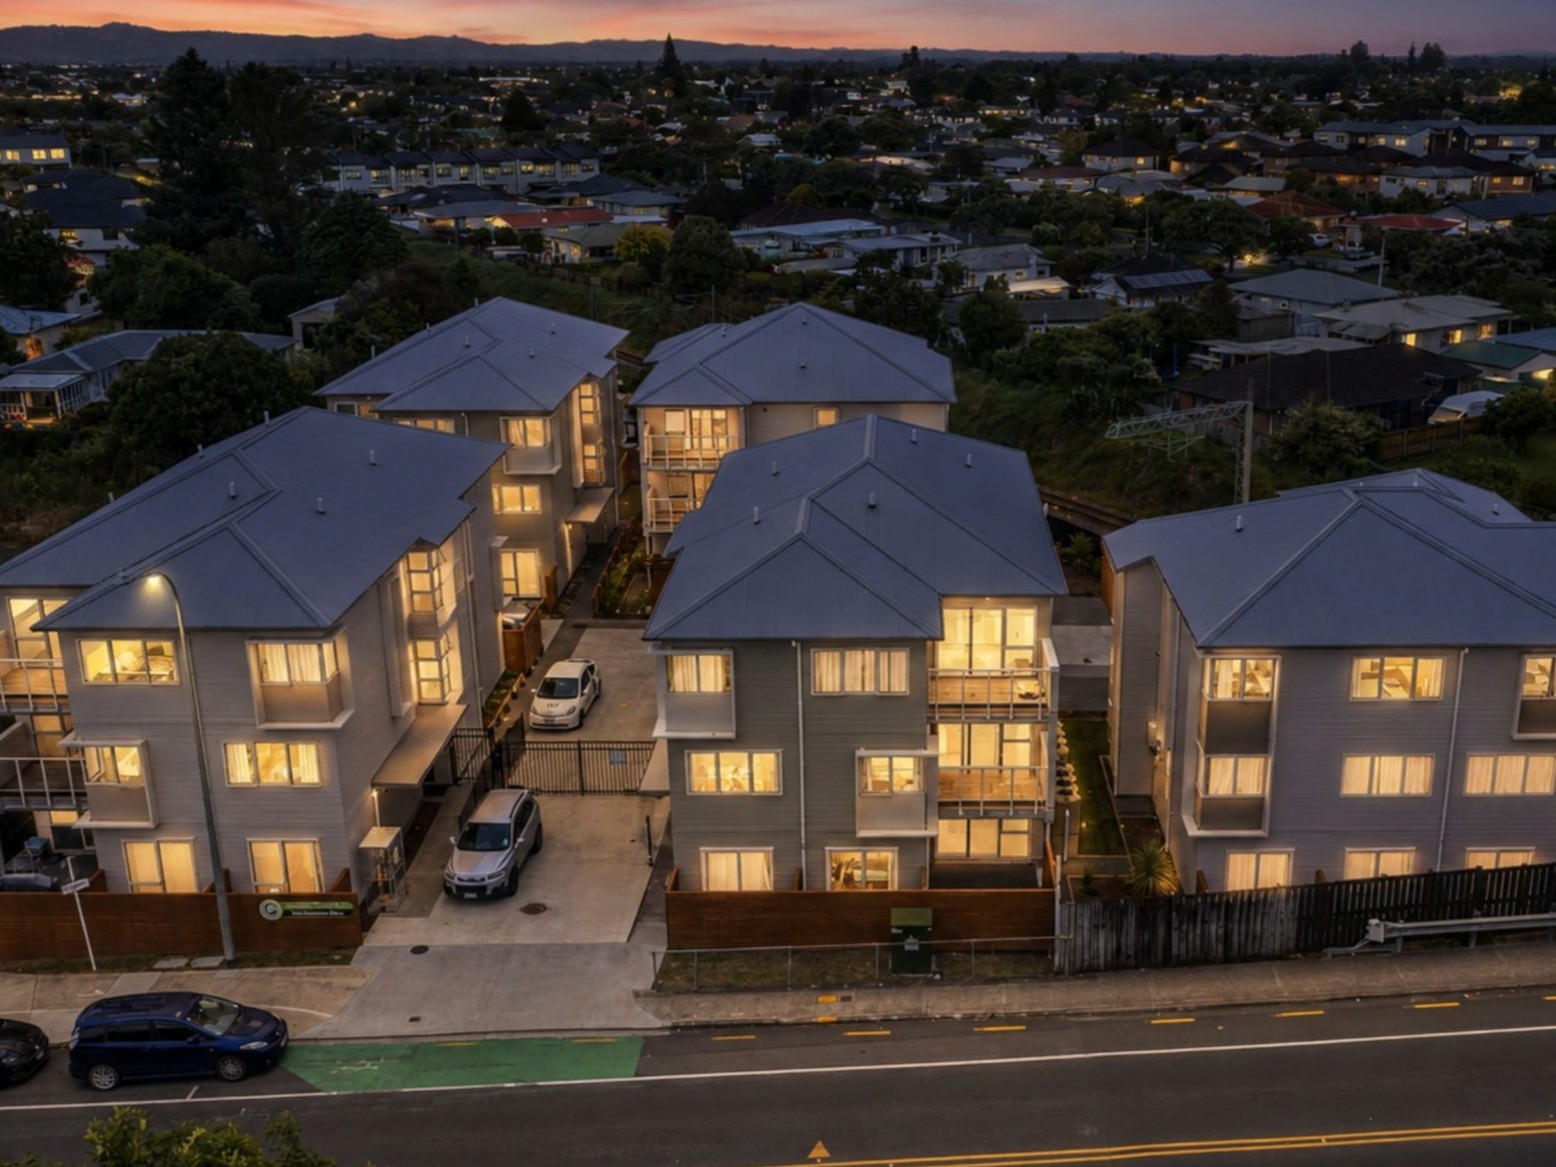
| Property Type | Social Housing Investment Portfolio |
| Estimated Value | ~NZD 17.35M |
| Estimated Yield | ~7.75% net |
| Tenure | 5 x Individual Freehold Titles |
| Buildings | 5 standalone buildings, 75 self-contained units total |
| Lease Term | 12-year leases with rights of renewal |
| Lease Structure | Net lease |
| Tenancy | Established charitable trust, government-aligned operator |
| Vendor Finance | Up to 75% LVR available for approved buyers |
| Method of Sale | Price by Negotiation |
Notes: A purpose-built, fully leased social housing portfolio comprising five standalone buildings, each held on a separate freehold title, completed in 2023 and currently operating at full occupancy. Leased to an established charitable trust aligned with government housing frameworks, with each building held on a 12-year net lease with rights of renewal. Common areas are professionally managed, removing the complexity typically associated with multi-building portfolio ownership. Vendor finance of up to 75% LVR is available for approved buyers.
Investment Potential: Social housing assets underpinned by government-aligned operators and long-term net leases sit in a structurally different risk position from standard commercial tenancies. Income is not sensitive to economic cycles, consumer confidence, or interest rate direction in the way that office or retail income is - making this asset unusually well-suited to a rate-hiking environment. At 7.75% net across five separate freehold titles, the yield spread over current term deposit rates is compelling at scale. The five separate title structure preserves flexible exit optionality including selective divestment or institutional roll-up. Contact us for full lease and financial details.
Malaysia
Kuala Lumpur (Decentralised Grade A Corridor) - Corporate Tower, En Bloc
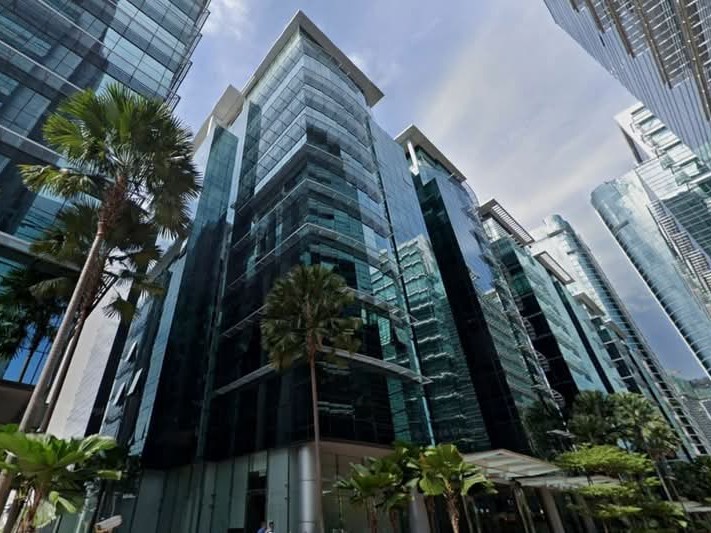
| Property Type | Grade A Commercial Office Tower (En Bloc) |
| Estimated Value | ~RM 228M |
| Estimated Yield | ~5.5% |
| Floor Area | ~247,000 sqft |
| Price per sqft | ~RM 923 psf |
| Tenure | Leasehold (98 years remaining) |
| Specification | Full corporate fit-out, 100% power backup, high-speed lifts, multi-level car park |
Notes: An en bloc Grade A corporate tower in one of Kuala Lumpur's most established and liquid decentralised office corridors, finished to full corporate specification including fibre-optic backbone, broadband from multiple providers, 100% electricity backup, and dedicated high-speed lifts. Offered as a single en bloc title, the asset suits either a regional corporate owner-occupier or an institutional value-add repositioning play within one of KL's most active commercial precincts.
Investment Potential: Malaysia's Q2 2026 GDP of 6.0%, confirmed on August 14, validates what this corridor has been demonstrating at the tenant level: occupier demand is structural, not speculative. Technology, financial services, and AI-adjacent firms expanding into quality KL office corridors are doing so against genuine economic expansion. With BNM holding the OPR at 2.75% and inflation contained at 1.9%, the financing environment for Malaysian commercial assets remains stable while counterpart markets navigate active rate hiking. The August pivot in global rate expectations adds a further layer of cross-border capital support. Contact us for the full asset brief and tenancy schedule.
Klang Valley Fringe - Grade A Corporate Office Tower, MSC Designated
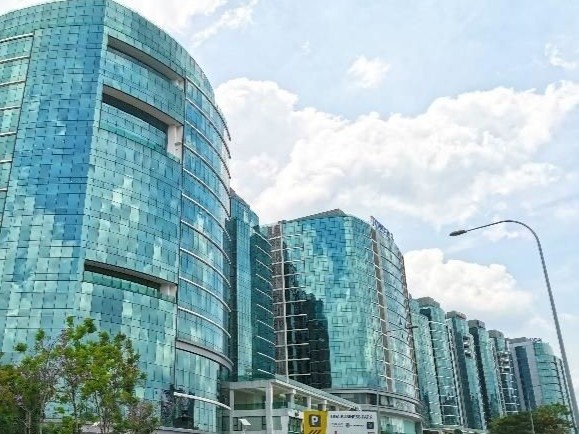
| Property Type | Grade A Corporate Office Tower |
| Estimated Value | ~RM 120M |
| Estimated Yield | ~6.0% |
| Floor Area | ~126,000 sqft |
| Tenure | Freehold |
| Designation | MSC Malaysia Cybercentre |
Notes: A boutique Grade A office tower within an established commercial hub in the Klang Valley fringe corridor, strategically positioned between Kuala Lumpur's CBD and the major industrial hubs of Shah Alam and Port Klang. The building carries MSC Malaysia Cybercentre designation, expanding the eligible tenant pool to include technology firms, digital infrastructure operators, and multinational companies seeking MSC incentives. Freehold tenure is a material differentiator at this price point in the corridor.
Investment Potential: The Klang Valley fringe office corridor has absorbed consistent demand from corporations decentralising from KL's CBD, and that trend has accelerated as Malaysia's technology and AI sector expansion creates genuine space requirements beyond what established inner-ring corridors can supply. MSC designation attracts a structurally growing tenant category with limited direct supply competition in the immediate precinct. Malaysia's 6.0% Q2 GDP, BNM's OPR hold, and easing global rate pressure following the US jobs data all point toward sustained stable financing conditions for Malaysian commercial assets. At RM 120M freehold with a 6.0% yield, the risk-adjusted return profile is among the more compelling in the Klang Valley mid-market office segment. Contact us for the full tenancy and leasing schedule.
For more info on any of the above listings, contact the Fairhaven team directly.
Petrus Yen - Petrus@fairhavenproperty.co.nz
Daarshan Kunasegaran - Daarshan.Kunasegaran@fairhavenproperty.co.nz
Disclaimer: The information provided is based on publicly available data and internal analysis. For informational purposes only. Not financial advice. Property details and projections are indicative only. Readers should conduct independent due diligence before making any investment decisions.